Chart Settings 
Specify the chart settings for the Data Logger view and Digitizer view.
Below is an example of a Chart Settings dialog box.
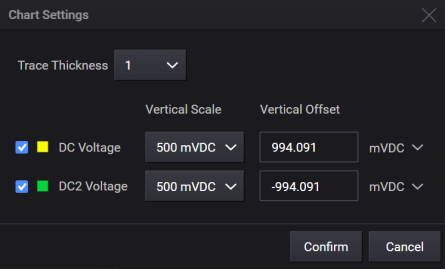
For charts with multiple traces, click the check box of the individual trace to show or hide its display.
Trace Thickness - Set the trace thickness.
Trace Color - Set the trace color. Click the color box of the individual trace to select the desired color from the color palette. The bins color of the histogram will be automatically set to the same color as trace color. Note that Overload conditions are shown on the chart with red color (see examples).
Vertical Scale - Set the scale for the vertical axis (y-axis).
Vertical Offset - Set the offset for the vertical axis (y-axis).